Welcome to the Aviation Weather Center
Overview
AviationWeather.gov has a new look! Some of the goals of the new website design were to provide a consistent page layout throughout, reduce duplication and limit the number of pages, and achieve mobile responsiveness. The website is organized by utilizing the main page to branch to an interactive map called the Graphical Forecasts for Aviation (GFA), various impacts dashboards, a data and imagery page, and a handful of other pages that provide weather information for the world airspace system. Check out the webinar tutorial video to the left to get a full overview of the website.
Main Page
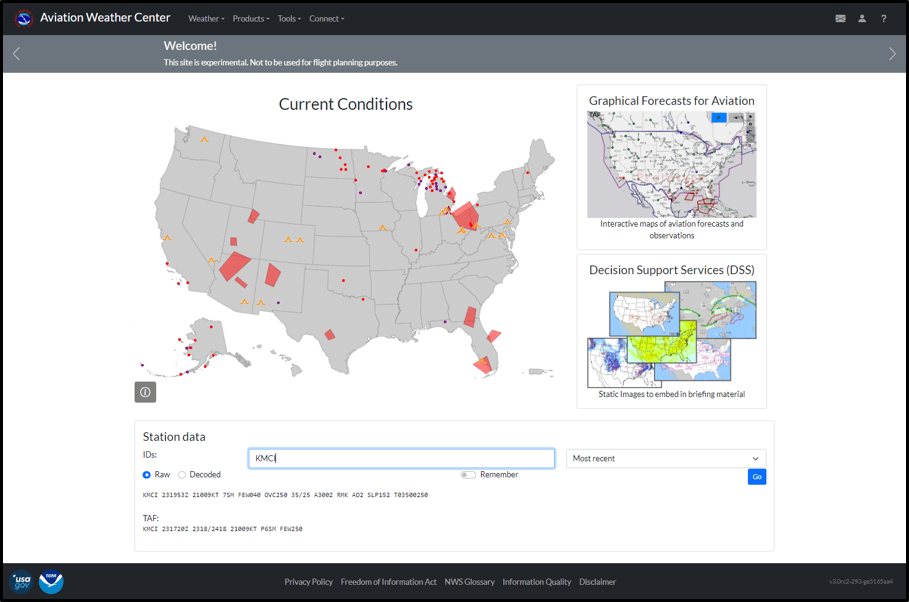
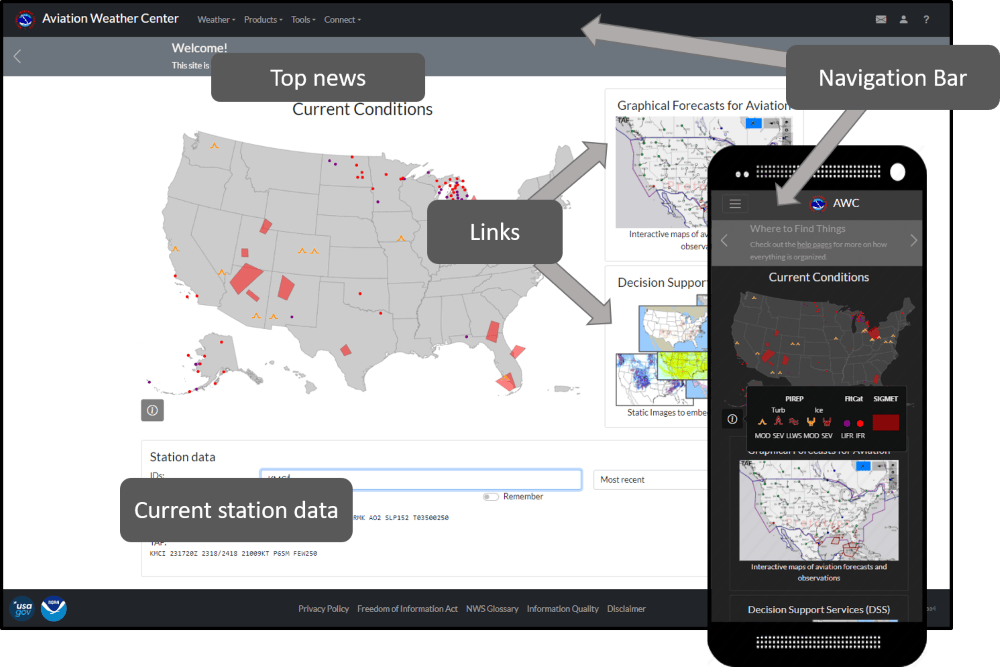
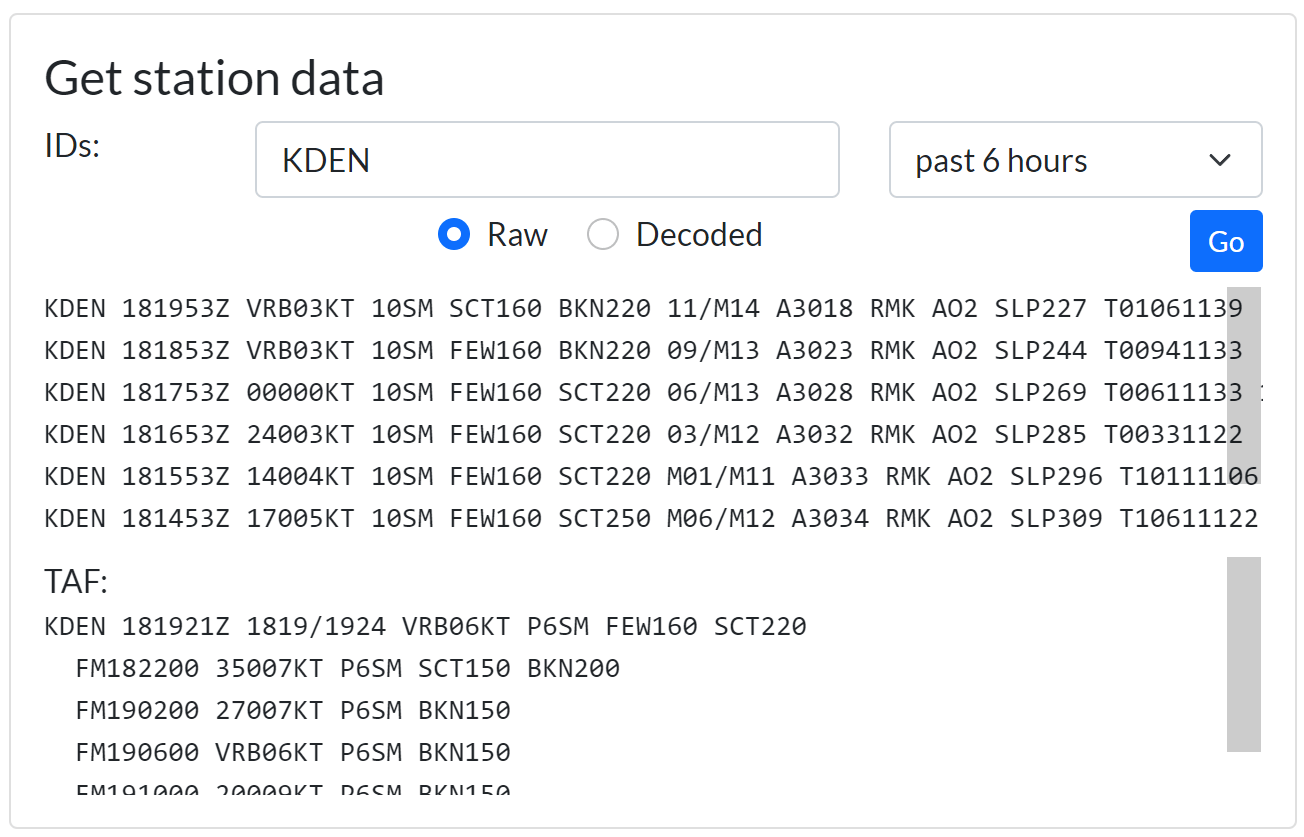
The main page utilizes the template visible on all pages of AviationWeather.gov. A header at the top guides the user through the website, and a footer at the bottom provides links to USA.gov and NOAA pages. There is a "Top News" bar along the top to provide details on any new updates to the website or important information for the user. The large static image in the center of the screen shows current aviation weather conditions utilizing AWC products. The smaller images provide links to additional data or tools within AviationWeather.gov. Get the latest station data by entering an airport identifier at the bottom.
Main Page Tutorial
Navigation Bar
The Navigation Bar along the top is consistent throughout each page on AviationWeather.gov and can help the user navigate through different parts of the webpage. Dropdowns on the left side of the navigation bar will load a new location on the site, and the icons on the left will provide additional support or pop-ups to assist in navigation or support questions. The Aviation Weather Center or AWC on mobile devices will always link back to the main page.
Weather
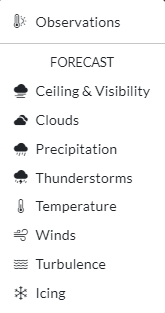
The weather dropdown menu will direct the user to the the Graphical Forecasts for Aviation (GFA) interactive map. Once viewing the GFA, the user can select other parameters and adjust settings on the map. For more information on the GFA, please view the GFA Help page.
These pages are designed to cover the fundamentals of a general aviation weather briefing, integrating gridded forecasts, SIGMETs, (G-)AIRMETs, and observations.
Products
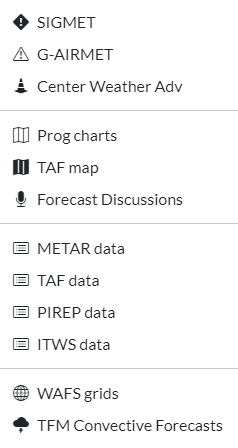
The products dropdown menu provides access to specific products.
SIGMET: View SIGMETs alone within GFA.
G-AIRMET: View G-AIRMETs alone within GFA.
Center Weather Adv: View Center Weather Advisories alone within GFA.
Prog Charts: View the Weather Prediction Center produced fronts and NDFD precipitation grids with GFA.
TAF map: View TAFs alone within GFA.
Forecast Discussions: View the aviation data from forecast discussions produced at Weather Forecast Offices.
METAR/TAF/PIREP data: Print out unformatted data for a certain location.
Wind/temp data: Legacy FB wind and temperature text products
ITWS data: View airport winds through the Integrated Terminal Weather System.
WAFS grids: Redirect to the NWS display of World Area Forecast System (WAFS) grids. The WAFS Internet File System (WIFS) can be accessed here. NOTE: An account is required to access WIFS data.
TFM Convective Forecasts: Traffic Flow Management (TFM) Convective Forecast (TCF), Extended TCF (eTCF), and Extended Convective Forecast Product (ECFP). More information on the TFM forecasts can be found by clicking here.
Tools
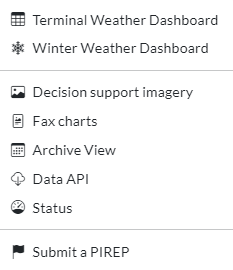
The tools dropdown menu leads to links within AviationWeather.gov that provide additional data and aviation decision support.
Terminal Weather dashboard: Forecasted time series display of weather conditions and color coded impacts.
Winter Weather Dashboard: Dashboard display of view potential winter weather impacts to core airports.
Traffic Flow Management Portal: Access quick links to additional aviation weather information.
Advanced map: GFA map with continuous timeline and flexible layer selection
Decision support imagery: Imagery designed for targeted CWSU briefings.
Fax charts: View and download static wind and temperature aloft fax charts, and Canadian Graphical Area Forecasts.
Archive View: Load the page exactly as it was up to two weeks in the past.
Data API: Application programming interface to access raw and decoded aviation data.
Status: View the status of data on AvationWeather.gov to confirm any outages or late data.
Submit a PIREP: Open a pop-up window to fill out a quick and easy form for PIREP submission. To register for an account click on the envelope at the top right corner and fill out the contact us form with the subject PIREP Access. Once you have gained permission, fill out the form under Submit a PIREP.
NOTE: You must be signed in to submit PIREPs.
Connect
The connect dropdown menu provides links to learn more about AWC through informational dialogs and social media.
About AWC: Learn more about AWC, NOAA, and our mission.
Twitter: Find us on Twitter.
Facebook: Find us on Facebook.
YouTube: Watch tutorial videos and research videos on our YouTube page.
Aviation Weather Testbed: Redirect to our testbed page to learn about current research and experiments.
Icons
The envelope icon on the right will open a pop-up to provide us with feedback or ask a question. Fill out the form and select SUBMIT at the bottom, our developers will get back to you as soon as possible.
The person icon will open a pop-up to sign-in to your account; only a few pages require an account. Use the dark mode toggle to switch between dark and light mode.
And lastly, the question mark will redirect you to the respective help page for the page you are viewing. For more help pages, click the FAQ tab on the help page you are on.
Top News
The welcome bar and top news bar will scroll through important information and updates to changes on the website. All new updates and changes will be listed here.
Current Conditions
The large image on the screen provides current AWC produced SIGMETs, submitted PIREPs, and IFR flight category dots. To view the observations more closely, add more information zoom and pan click on the image and utilize the GFA interactive map.
Links to additional data
The images to the right of the current conditions on a desktop, or below the current conditions on a mobile device provide links to AWC flagship products. Click on the Graphical Forecasts for Aviation card to link directly to the GFA. You can modify the view or select alternative weather products from within the interactive view. Click the Decision Support Service (DSS) card to view our static imagery.
Station Data
Footer
The footer, found on all pages except the full page interactive maps, provides links to additional Department of Commerce, National Weather Service, and USA.gov information.
A
Area Forecast (FA) — Forecast of Visual Flight Rules (VFR) clouds and weather conditions over an area as large as the size of several states, used in conjunction with AIRMETs. FAs over CONUS were discontinued and replaced with the GFA.
Area Forecast Discussion (AFD) — Narrative forecast informational discussion issued by local NWS Weather Forecast Offices.
AIREP — Reports of actual weather conditions encountered by aircraft, typically automated. See also PIREP.
AIRMET (Airmen's Meteorological Information) — Weather advisories of weather that may be hazardous to aircraft, but are less severe than SIGMETs, that depict conditions over a six hour period with a twelve hour outlook. AIRMETs over CONUS have been replaced by G-AIRMETs.
Alaska Aviation Weather Unit (AAWU) — MWO responsible for Alaskan airspace. Website.
Altimeter setting — Station pressure (the barometric pressure at the location the reading is taken) which has been corrected for the height of the station above sea level.
Application Programming Interface (API) — Machine-to-machine data access interface.
Automated Surface Observing System (ASOS) — Weather reporting system which provides surface observations via digitized voice broadcasts and printed reports. Maintained by NWS, FAA, and the Department of Defense.
Automated Weather Observing System (AWOS) — Automated weather reporting system consisting of various sensors, a processor, a computer-generated voice subsystem, and a transmitter to broadcast weather data. Generally AWOS are maintained by the local airport authority, do not report all of the same elements as ASOS, and may not have the same level of backup sensors or maintenance response levels.
Aviation Weather Center (AWC) — National center that issues warnings, forecasts, and analyses of hazardous weather for aviation. More information.
Aviation Weather Testbed (AWT) — A research entity of the Aviation Weather Center comprised of a collaborative team of developers and researchers dedicated to leading the forefront of innovative meteorological techniques for aviation forecasting. Their efforts ensure the protection of pilots and passengers, support of operations, and constant improvement of the forecasting process.
B
Beam blockage — Radar phenomenon that occurs when the radar beam is blocked by terrain and is particularly predominant in mountainous terrain.
BECMG — Gradual change in TAF forecast conditions over longer period, usually two hours.
C
Categorical Amendment Criteria (CAC) — Customer-based impact thresholds for TAF amendments in the US. More information.
Ceiling — The height above the earth’s surface of the lowest layer of clouds, which is reported as broken or overcast, or the vertical visibility into an obscuration.
Center Weather Advisory (CWA) — Aviation weather advisory for conditions meeting or approaching national in-flight advisory (AIRMET, SIGMET or SIGMET for convection) criteria. More information.
Center Weather Service Unit (CWSU) — Weather offices that provide weather forecasts and advisories to the 21 Air Route Traffic Control Centers (ARTCCs). More information.
Clear air turbulence (CAT) — Turbulence occurring in cloudless regions that causes buffeting of aircraft.
Coordinated Universal Time (UTC) — Standardized universal time that aligns approximately with mean solar time at the prime meridian (zero degrees longitude). Also referred to as Zulu (Z) time and the successor to Greenwich Mean Time (GMT).
County Warning Area (CWA) — Area of responsibility for local NWS Weather Forecast Offices.
Current Icing Potential (CIP) — Numerical model guidance of current areas conducive to airframe icing.
Convective Outlook — Categorical depiction of non-severe thunderstorm areas and severe thunderstorm threats across the contiguous United States issued by the NWS Storm Prediction Center.
Crosswind — Wind that has a component directed perpendicularly to the heading of an aircraft or runway.
Cumulonimbus (Cb) — very large, tall, billowing cumulus clouds, sometimes referred to as thunderheads. They often produce lightning, thunder, rain, sometimes waterspouts, and on rare occasions severe weather such as hail, high winds, or tornadoes.
D
Dewpoint — A measure of atmospheric moisture. It is the temperature to which air must be cooled in order to reach saturation (assuming air pressure and moisture content are constant). A higher dew point indicates more moisture present in the air.
Density altitude — Pressure altitude corrected for variations from standard temperature. When conditions are standard, pressure altitude and density altitude are the same. If the temperature is above standard, the density altitude is higher than pressure altitude. If the temperature is below standard, the density altitude is lower than pressure altitude.
E
Echo top — Radar indication of the highest altitude of precipitation. Height above ground of the center of the radar beam using the tilt, or scan, that contains the highest elevation where reflectivities greater than 18 dBZ can be detected.
Eddy Dissipation Rate (EDR) — Objective measure of turbulence intensity without regard to aircraft characteristics, expressed as the cube root of the dissipation rate of turbulent kinetic energy.
Embedded thunderstorms — Thunderstorms or cumulonimbus (CB) clouds that are embedded in cloud layers or concealed by haze.
Extended Convective Forecast Product (ECFP) — Graphical probabilistic forecast of of likely thunderstorms covering the 48 contiguous state for day two through four.
Extended TCF (eTCF) — High confidence graphical forecast of convection covering the 48 contiguous states issued every two hours from 10 to 30 hours into the future. Expands upon the forecaster-in-the-loop TCF product.
F
FA — See Area Forecast
FB winds / FD winds — Legacy wind and temperature forecast product issued four times a day.
Forecast Icing Potential (FIP) — Numerical model guidance forecast of atmospheric conditions conducive to airframe icing.
Front — Boundary between two different air masses.
G
G-AIRMET (Graphical AIRMETs) — Graphical advisory of weather that may be hazardous to aircraft, but are less severe than SIGMETs. More information.
Geostationary Lightning Mapper (GLM) — Satellite based optical detector used to identify lightning flashes.
Global Ensemble Forecast System (GEFS) — Ensemble global weather numerical model system. Guidance used for probabilistic aviation weather forecasts in the Winter Weather Dashboard.
Graphical Forecast for Aviation (GFA) — Products intended to provide the necessary aviation weather information to give users a complete picture of the weather that may impact flight in the United States (including Alaska & Hawaii), the Gulf and Caribbean, and portions of the Atlantic and Pacific Oceans. Website.
- GFA-LA — GFA low altitude mode provides weather information relative to ground level (AGL) at more frequent intervals, intended for the Helicopter Air Ambulance community and other low altitude flight.
Graphical Turbulence Guidance (GTG) — Numerical model driven multi-diagnostic turbulence guidance.
H
High Resolution Rapid Refresh (HRRR) — Hourly updated high-resolution numerical model producing forecasts for the contiguous United States.
Honolulu Weather Forecast Office (HFO) — MWO responsible for Hawaiian airspace. Website.
I
In-Flight Advisory Points — Fixed reference points used for advisory products.
Integrated Terminal Weather System (ITWS) — FAA system that provides automated current and forecast weather information at certain airport terminals. AWC ITWS data page displays airport wind information from the ITWS system. More information.
Inversion — An increase in temperature with altitude.
Isobar — Line which connects points of equal barometric pressure. Mean sea level isobars are shown on surface prog charts.
L
Localized Aviation MOS Product (LAMP) — Statistical product that uses observations, MOS, and model output to provide hourly updated aviation forecast guidance.
M
Mean sea level pressure (MSLP) — Pressure reading most commonly used by meteorologists to track weather systems at the surface. Estimates the pressure that would exist at sea level at a point directly below the station using actual temperatures.
METAR — Standardized format for aviation weather observations. Typically includes the airport identifier, time of observation, wind, visibility, Runway Visual Range (RVR), present weather phenomena, sky conditions, temperature, dewpoint, and altimeter setting. More information.
Meteorological Watch Office (MWO) — Weather office specified by ICAO as responsible for maintaining watch of meteorological warnings (SIGMETs) for aviation.
Mountain obscuration — Conditions over significant portions of mountainous geographical areas are such that pilots in flight should not expect to maintain visual meteorological conditions or visual contact with mountains or mountain ridges near their route
Multi-Radar/Multi-Sensor (MRMS) — System of automated algorithms that integrate data from multiple radars producing the radar mosaics used on the observation tab.
N
National Airspace System (NAS) — Airspace, navigation facilities, and airports of the United States.
National Centers for Environmental Prediction (NCEP) — Nine major United States national forecast centers, including AWC, that provide domestic and international forecasts and advisories.
National Digital Forecast Database (NDFD) — Suite of gridded forecast products generated by the NWS.
P
PIREP (pilot report) — Reports of actual weather conditions encountered by aircraft. More information.
PROB30/PROB40 — Probable condition in a TAF at 30% or 40% probability.
R
Rapid Refresh (RAP) model — Hourly updated numerical model producing forecasts for North America.
Runway visual range (RVR) — Distance over which runway centerline markings or lighting can be seen.
S
Severe thunderstorm — Thunderstorm that produces a tornado, winds of at least 58 mph (50 knots or ~93 km/h), and/or hail at least 1" in diameter.
Sierra (AIRMET) — Advisories issued for moderate ceiling and visibility restrictions and mountain obscuration.
SIGMET (Significant Meteorological Advisory) — Advisory for weather that may be hazardous to aircraft. More information.
SigWx — Significant weather chart issued by World Area Forecast Centers displaying cloud, turbulence, jet stream,tropical cyclone, and volcano forecast information.
SPECI — Unscheduled weather observation report issued between routine METAR issuances when conditions change significantly.
Supercooled Large Droplets (SLD) — Liquid droplets at a temperature below freezing that are much larger than typically encountered in airframe icing conditions, on the order of 1 mm. Freezing rain and freezing drizzle are forms of SLD.
T
Tango (AIRMET) — Advisories issued for moderate turbulence, sustained strong surface winds, and non-convective low-level wind shear.
TEMPO — Temporary change in TAF forecast conditions, expected for less than one hour total and less than half the period.
Terminal Area Forecast (TAF) — Concise statement of the expected meteorological conditions significant to aviation for a specified time period within 5 sm of the center of the airport’s runway complex (terminal) using the same weather codes found in METARs. More information.
Terminal Weather Dashboard — Time series display of weather conditions and potential impacts. Also known as the TAF Board.
TFM Convective Forecast (TCF) — High confidence graphical forecast of convection covering the 48 contiguous states relevant to TFM. More information.
Traffic Flow Management (TFM) — Strategic high level management of the National Airspace System (NAS).
U
UTC time — See Coordinated Universal Time (UTC).
V
Visibility — Distance at which a given standard object can be seen and identified with the unaided eye.
Volcanic Ash Advisory (VAA) — Advisories issued by VAACs indicating the presence of volcanic ash that may endanger aviation.
Volcanic Ash Advisory Center (VAAC) — Offices responsible for coordinating and disseminating information about volcanic ash that may endanger aviation. The US has two VAACs, Washington and Anchorage.
W
World Area Forecast Center (WAFC) — Center that provides real-time weather information as part of WAFS. There are two such WAFCs, Washington and London.
World Area Forecast System (WAFS) — System to provide the worldwide aviation community with operational meteorological forecasts and information about meteorological phenomena required for flight planning and safe, economic, and efficient air navigation.
WAFS Internet File System (WIFS) — Official distribution system for WAFS data from WAFC Washington (AWC). More information.
Winter Weather Dashboard — Probabilistic dashboard display of potential winter weather impacts to core US airports and their alternated. Website.
Z
Zulu (Z) time — See Coordinated Universal Time (UTC).
Zulu (AIRMET) — Advisories issued for moderate icing conditions and freezing levels.
About AWC
The Aviation Weather Center (AWC) located in Kansas City, Missouri, issues warnings, forecasts, and analyses of hazardous weather for aviation. Staffed by 76 personnel, the center develops warnings of hazardous weather for aircraft in flight and forecasts of weather conditions for the next two to four days that will impact both domestic and international aviation. The Center leads the collaborative effort to develop a forecast of expected convective events for the entire country every two hours used by FAA to manage aviation traffic flows across the country.
The AWC also maintains a six-person unit assigned to the FAA National Command Center located in Warrenton, VA that provides impact-based decision support services (IDSS) directly to FAA National Operations Managers (NOMs). Additionally, the AWC is one of two global World Area Forecast Centers designated by the International Civil Aviation Organization (ICAO), and hosts the NWS Aviation Weather Testbed (AWT) which acts as a catalyst to accelerate aviation weather research into sustained and supportable operations.
Click here to learn more about the history of AWC.
Our Mission
The Aviation Weather Center delivers consistent, timely and accurate weather information for the world airspace system. We are a team of highly skilled people dedicated to working with customers and partners to enhance safe and efficient flight.
Our Vision
To be the trusted authority and leading innovator for aviation weather information.
Our Quality Policy
The AWC delivers consistent, timely and accurate weather information for the world airspace system. This is accomplished through adherence to applicable requirements by a team of highly skilled people who are committed to continually improving the AWC’s quality management system.
About NCEP
The National Oceanic and Atmospheric Administration created the National Centers for Environmental Prediction (NCEP) to take advantage of improving technology and better serve the public and modernized National Weather Service. The NCEP’s goal is to protect life and property, as well as mitigate economic loss, by providing accurate forecasts and forecast guidance products to weather service field offices.
The NCEP prepares and makes available national forecasts and outlooks of weather and climate. Meteorologists currently generate weather forecasts for three to five days, soon to extend to seven days. Climate predictions are made for two weeks out to a year.
Nine national centers comprise the NCEP:
- Aviation Weather Center
- Climate Prediction Center
- Environmental Modeling Center
- NCEP Central Operations
- National Hurricane Center
- Ocean Prediction Center
- Storm Prediction Center
- Space Weather Prediction Center
- Weather Prediction Center
The NCEP was established in 1958 as the National Meteorological Center. Since the center’s beginning, operational weather forecasting has transformed from an infant discipline into a mature science.
Visiting AWC
The Aviation Weather Center is located about three miles southeast of the Kansas City International Airport. It is co-located with the NWS Central Regional Headquarters and the NWS Training Center.
Address:
7220 NW 101st Terrace
Kansas City, MO 64153-2371
Visiting Kansas City
Kansas City is known for its barbeque, jazz, fountains, and home to the Kansas City Chiefs. More information can be found on the city web site.
| Page | Old Links | New Location |
|---|---|---|
| ADDS data server | /dataserver, /adds/dataserver_current | Data API |
| Cache files | /adds/dataserver_current/current/metars.cache.csv.gz | /data/cache/metars.cache.csv.gz |
| ADDS flight path tool | /flightpath | /gfa cross section tool |
| HEMS Tool | /hemst | /gfa/?tab=obs&mode=la |
| ADDS data pages | /adds/metars, /adds/tafs, /metar/data, /taf/data | METAR and TAF data pages |
| OpenLayers displays (e.g. "METAR map", "TAF map") | /gfa | |
| SIGMET static images | /sigmet/plot | /graphics select SIGMET |
| SIGMET data page | /sigmet/data | Data discontinued |
| G-AIRMET static images | /gairmet/plot | /graphics select GAIRMET |
| MIS display | /cwamis/data | Data discontinued |
| CWA data page | /cwamis/data | /gfa/#cwa |
| TCF, eTCF static graphics | /tcf/plot | /tcf, /gfa/#tcf |
| ECFP static graphics | /ecfp/plot | /ecfp |
| Icing CIP/FIP static graphics | /icing/plot | /graphics select Icing |
| Freezing Level static graphics | /icing/frzlvl | interactive GFA select freezing level |
| GTG static graphics | /turbulence/gtg | /graphics select Turbulence |
| FB wind interactive map | /windtemp | /gfa/#winds |
| FB wind data page | /windtemp/data | Data discontinued |
| Wind/temp static plots | /windtemp/plot | Data discontinued |
| Prog chart SigWx charts | /progchart/swh | /graphics select SigWx charts |
| Sfc. prog charts | /progchart/sfc | /gfa/#progchart interactive map /graphics select WPC prog chart |
| METAR, TAF, PIREP static images | /metar/plot, /taf/plot, /airep/plot | /gfa/?tab=obs&layers=metar,airep /gfa/?tab=taf interactive maps |
| METAR site page | /metar/info | /data/metar |
| Aviation Forecasts | /gfa/plot | Data discontinued |
| Area Forecast data page | /areafcst | Data discontinued |
| AIREP/PIREP data page | /airep/data | Data discontinued |
| Radar static images | /radar/plot | radar.weather.gov |
| Satellite static image | /satellite/plot, /satelite/intl | weather.rap.ucar.edu/satellite/ |
| Flight Folder page | /flightfolder | fax charts |
| Flight Folder documents/static images | /iffdp | Data discontinued |
| Gate Forecasts interactive display | /trafficflowmgmt/gate | /graphics select TFM gate forecast |
| TFM Portal | /trafficflowmgmt/portal | TFM Portal |
| TAF Board | /impact board | Terminal Weather Dashboard |
| Standard Briefing | /briefing | Data Discontinued |
| News Page | /news/front | AWC home page |
What has changed recently?
The entire site was overhauled in October 2023. For information about the most recent updates, please see the change log.
How can I keep up with planned changes?
Major changes are announced through NWS Service Change Notices. Further information and other significant changes are shown on the upcoming changes page. Subscribe to the RSS or JSON feed for regular updates.
How often do you update the website?
We fix critical bugs as soon as possible, and we deploy functional upgrades regularly. Please let us know if you find something that isn't working.
Why can't I log in to my account?
Most features of AviationWeather.gov do not require an account. If you recently signed up for a new account, please check your email (including spam folders) for a confirmation email as email addresses must be verified. Accounts are generally approved within one to two business days.
Where is the METAR page?
The interactive Graphical Forecasts for Aviation observation tab displays METARs along with other current data including surface fronts and radar imagery. To view METARs alone, click on the Layers button at the top right corner of the map and deselect items you do not wish to view. Decoded METARs can be displayed by enabling the "decoded METARs" option in the Map Options under the gear icon on GFA.
Raw and decoded textual METAR data can be displayed by selecting the Products dropdown and selecting METAR data.
Where is the Satellite/Radar page?
Satellite and radar imagery are available on the observations tab of the interactive Graphical Forecasts for Aviation, that displays surface observations, imagery, fronts, and more in one place. Satellite imagery is an optional layer available from the layer selector in the upper right corner of the map. To display satellite or radar imagery alone, deselect items on the layer selector to simplify the display.
How can I submit PIREPs?
Sign up for an account on our registration page, select PIREP Submit Access, and be sure to include your airman's certificate number or affiliation with an airline, flight school, government or military organization for validation purposes to streamline the process. Accounts are validated via the FAA Airmen Inquiry.
Then watch your email in order to verify your address and then confirming your account. Once you have an account and are logged in, select "Submit a PIREP" from the Tools dropdown and fill out the form. For more information on PIREP submit, use the link at the bottom, or click here. For more information on PIREP content, please see the PIREP data help page.
How do I access the Flight Path Tool?
The flight path tool is now embedded into the interactive Graphical Forecasts for Aviation map. Click on the route button along the right side of the map to open the display. Enter the airports to navigate, and select the product you wish to display from the dropdown. Watch a video on how to use the cross sections here.
Where is the HEMS (Helicopter Emergency Medical Services) tool?
The HEMS tool has been integrated into the interactive Graphical Forecasts for Aviation. Click on the helicopter button in the upper right part of the map to switch GFA from general aviation mode into low-altitude mode, which offers similar features as the HEMS tool.
What happened to ADDS?
The ADDS static graphics were phased out and replaced with the Graphical Forecasts for Aviation, which offers greater flexibility and configurability; some static graphics continue to be available for decision support. The ADDS Text Data Server has been succeeded by the Data API. Please let us know if you need assistance with the migration.
How can I display list of METARs and/of TAFs? What about decoded products?
The METAR and TAF data pages provide access to raw, tabular, and decoded output that automatically refreshes every five minutes. The page is designed for quick lookups and printability.
Where is the Text Data Server? How do I download METARs?
The Text Data Server was discontinued and has been replaced by the Data API. The new data offerings are more flexible and provide more data. Interfaces designed for greater compatibility with the Data Server to ease the transition as well as cache files to retrieve many reports at once are also available.
How do I access data for previous dates?
The METAR data page displays up to the previous 96 hours of observations. The Archive View allows viewing nearly all products on the site as they were presented for up to the past two weeks. For data more than 14 days old please reference the resources available on bottom of the Archive View page.
Data appears to be missing. Where can I find more information?
Automated status information and the latest announcements can be found on the status page
Why is a particular station not reporting?
The site generally displays all observations within a minute or two of being reported as we receive it. Individual station outages are usual indicative of a problem at the source. AWC does not maintain weather stations or observing platforms.
What do all of the map symbols indicate?
A full listing of map symbols is available.
Why is the map dark?
Dark mode is automatically applied based on systems settings. Selecting the person icon in the upper right and and selecting Light disables this mode.
