Graphical Forecasts for Aviation (GFA) Help
The Graphical Forecasts for Aviation (GFA) web page is intended to provide the necessary aviation weather information to give users a complete picture of the weather that may impact flight in the United States (including Alaska & Hawaii), the Gulf and Caribbean, and portions of the Atlantic and Pacific Oceans. The web page includes observational data, forecasts, and warnings that can be viewed from 18 hours in the past to 18 hours in the future. Hourly model data and forecasts, including information on clouds, flight category, precipitation, icing, turbulence, wind, and graphical output from the National Weather Service’s National Digital Forecast Data (NDFD), are available. Low altitude data, previously found within the Helicopter Emergency Medical Services (HEMS) tool, is available to aid the Helicopter Air Ambulance (HAA) community and other low altitude flights. Built with modern geospatial information tools, users can pan and zoom to focus on areas of greatest interest.
Product Overview
The Graphical Forecasts for Aviation (GFA) include gridded displays of various weather parameters as well as National Weather Service (NWS) textual weather observations, forecasts and warnings. Icing, turbulence, and wind gridded data are three-dimensional. Other gridded data are two-dimensional and may represent a “composite” of a three-dimensional weather phenomenon or a surface weather variable such as horizontal visibility.
The weather observations and forecasted data are listed under the Weather dropdown menu within the page header. Forecaster produced warnings and advisories can be found under the Products dropdown menu, along with TAF forecasts, Prog Charts, and Forecast Discussions. Note: The weather that extends beyond the outlined region have been masked out for this page, and therefore does not indicate the absence of such phenomena in these areas.
Low Altitude (LA) mode — Switch from General Aviation (GA) to Low Altitude (LA) by using the airplane and helicopter icons at the top of the display. Product adjustments for GFA-LA are labeled "Low Altitude" under the corresponding data dropdown.
Extended Range (ER) mode — Forecasts available out to four days on Wind and Temperature pages. Select the calendar icon from the top of the display. Product adjustments for GFA-ER are labeled "Extended Range" under the corresponding data options.
Observations
Station plots showing the METARs valid for the selected time from the time slider are displayed with PIREPs overlaid, a lowest angle reflectivity radar, SIGMETs and NWS Warnings.
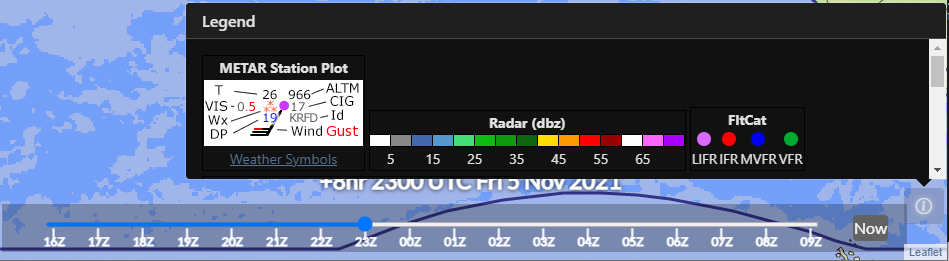
Station Plots

Station model plots are used to depict current surface weather conditions.
- Temp: temperature plotted in the upper left in Fahrenheit (Celsius)
- Wx: present weather plotted left of the center circle with the symbol indicating weather occurring (see symbols table)
- Vis: horizontal visibility plotted to the left of the present weather in miles (km)
- Dew: dew point temperature plotted in the lower left in Fahrenheit (Celsius)
- Wind/gust: plotted as a barb from the center circle in the direction the wind is from. Full lines off the main barb indicated 10 kts, half lines 5 kts, and triangular flags 50 kts. A circle indicated calm or variable winds.
- Alt: altimeter setting plotted in the upper right as the last three digits in inches Hg (hPa)
- Cig: cloud ceiling plotted to the right in hundreds of feet
- Id: four letter station identifier plotted in the lower right
- Flt cat/cover: cloud cover symbol (see symbols) plotted in the center. Color indicates flight condition.
Satellite
A global satellite mosaic constructed from the five geostationary satellites plus appropriate polar orbiter imagery is available. The resulting image is created every 30 minutes from available imagery. There are three types of images available:
Radar
The GFA uses the Multi-Radar/Multi-Sensor (MRMS) radar mosaic produced by the NWS. The radar image combines over 140 NEXRAD radars into a single mosaic. Each of these radars implements the WSR-88D technology. The "Doppler" capability of these radars uses shifts in the phase of the reflected energy to determine the velocity of the particles towards or away from the radar. The effective detection range is between 80 and 140 nautical miles, depending on the intensity of the precipitation. Additional post-processing is performed to remove some ground clutter and anomalous propagation (AP). The limitations of the radar such as blockage by mountains, lack of radar to radar overlap and over-processing of clutter and AP can cause the image to not show precipitation where there might be some. The display incorporates the latest radar image plus the previous 4 into a loop of radar data showing progression of precipitation echoes. By moving the time slider into the past, the radar loop will always show the latest 5 images ending in the time shown in the slider box. The valid time of the radar image is displayed in the top left corner of the map.
Layer Selector
Global Lightning
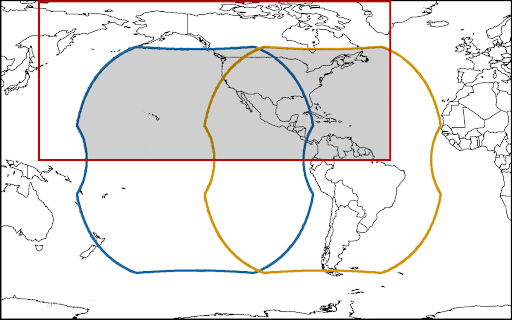
Gridded data from the Geostationary Operational Environmental Satellite (GOES) Geostationary Lightning Mapper (GLM) can be viewed within the GFA domain, as plotted below, by checking the Lightning box in the layer dropdown found in the top right corner of the display. The GLM provides enhanced visualization of convection beyond the extent of ground-based observations for GOES East and West up to 55 deg N as shown below. The map below displays GLM Coverage relative to the GFA domain. The GFA domain is outlined in red, with the satellite coverage from GOES West and GOES East in blue and yellow, respectively. The plotted GLM data is displayed in the shaded region.
Gridded Flight Category Analysis
The gridded analysis product provides near surface ceiling and visibility information every 15 minutes. It's important to note that the analysis is an interpolation between observation points, and therefore may not represent actual conditions occurring. The gridded guidance is using observations and interpolating between those points using background statistics The ceiling and visibility are used together to classify the flight category as VFR, MVFR, IFR, and LIFR (see table below). This set of rules is commonly used throughout the aviation industry. Ceiling grids are color-coded to show ceilings up to 3000 ft AGL, and visibility displays color-coded grids for visibility up to 5 miles. Values above 3000 ft AGL for ceilings, or 5 miles visibility are transparent.
| Category | Ceiling | Visibility | |
|---|---|---|---|
| LIFR | below 500 feet AGL | and/or | less than 1 mile |
| IFR | 500 feet to below 1000 feet AGL | and/or | 1 mile less than 3 miles |
| MVFR | 1000 feet to 3000 feet AGL | and/or | 3 to 5 miles |
| VFR | greater than 3000 feet AGL | and | greater than 5 miles |
METAR
Weather stations from around the world report weather conditions typically once an hour using the WMO approved METAR format. These data are centrally collected by each country and distributed internationally by WMO and other services. AWC gathers data through a variety of feeds provided by NWS. The METAR observations are plotted using the standard station model where temperature, dewpoint, winds, altimeter setting, weather, ceiling and visibility are displayed around the station location. The data plotted comes from the latest available observation, including SPECIs. The stations displayed follow a progressive priority scheme that will show more stations depending on zoom level. Flight category and cloud coverage is indicated by the colored dots of the observation stations. Learn how to configure the data displayed by each METAR in the map options on the Tutorial tab to view only ceilings, visibility, or winds.
Flight Cat
The flight category checkbox displays only the flight conditions at a particular airport as a colored dot. The dots are purple, red, blue, or green and represent LIRF, IFR, MVFR, and VFR, respectively. A yellow circle around the green VFR dot indicates there are cloud bases below 3,000 ft to indicate potential problems with low level flights. The flight category display uses the same priority filter system as the METAR plots but the density is much higher.
PIREPs
An aircraft report is a report of actual weather conditions encountered by an aircraft while in flight. A PIREP is reported by a pilot to indicate encounters of hazardous weather such as icing or turbulence and transmitted in real-time via radio to a ground station. Encoded and decoded PIREP text information is available by clicking on the individual report. The type, altitude, range, and report age of PIREPs that are displayed can be configured through the map options dialog.
Fronts
Surface analysis fronts, mean sea level pressure (MSLP) contours, and pressure centers from the Weather Prediction Center are available over North America including the contiguous US and Alaska. The data are produced every three hours and are generally available two hours after the valid time.
Forecasted fronts can be found under Prog Charts in the Products dropdown.
Warnings
All SIGMETs and National Weather Service (NWS) warnings that impact aviation are plotted. By clicking on the polygon or station plot, the user can view text information which displays the hazard name, the NWS Office that issued the warning, and the time the warning ends, or the full decoded METAR.
G-AIRMET
Various G-AIRMETs can be toggled on and off. For more information on G-AIRMETs, use the SIGMET/AIRMET/CWA/NWS Warnings tab below.
Ceiling & visibility
Model derived surface flight category forecast grids are displayed. Flight category is color-coded for MVFR, IFR and LIFR. Areas with VFR conditions (ceiling greater than 3000 ft AGL and greater than 5 miles of visibility) are transparent. MVFR conditions occur with a ceiling 1000 ft to 3000 ft AGL and/or visibility 3 miles to 5 miles. IFR conditions include ceiling height less than 1,000 feet AGL and/or visibility less than 3 miles. Low IFR (LIFR) is a sub-category of IFR where ceiling heights are below 500 ft AGL, and/or visibility is less than 1 mile.
Ceiling and visibility grids are available by selecting the dropdown button within the layer selector. Ceiling grids are color-coded to show ceilings up to 3000 ft AGL, and Visibility displays color-coded grids for visibility up to 5 SM. Values above 3000 ft AGL or 5 SM visibility are transparent. Additionally, Density Altitude at the surface is available in the same dropdown. The density altitude deviation depicts the aviation effect of high surface temperatures that lower the air density and require longer runway lengths before an aircraft may lift off the runway. The values range from zero to 4000 feet indicating the perceived additional altitude of the runway rather than the actual elevation.
The Weather Symbol overlays NDFD precipitation symbols on the graphic.
G-AIRMET and SIGMET polygons that affect ceiling and/or visibility (volcanic ash, blowing dust/sand (IFR), convective, tropical cyclone, and international thunderstorm SIGMETs and G-AIRMET Sierra) are overlaid on the graphic. NWS Hazards for Winter Storm, Blizzard, Blowing Dust, and Marine Dense Fog are overlaid on the graphic. Dense Fog and Freezing Fog will be added in the future.
Clouds
Model derived cloud fraction (few, scattered, broken, overcast) is displayed for clouds below FL180 each hour. Model bases and tops are available by selecting the dropdown button within the layer selector. All color-coded grids and text information relays cloud heights in feet above Mean Sea Level (MSL).
The Weather Symbol overlays grid circles which indicate the coverage at that particular location. The density of the grid circles increase as the user zooms in on the map. Text data displays layers and tops at each grid point. Cirrus or CI above indicate cirrus type clouds present above FL180.
NOTE: The color-coded grid and the grid circles are model-derived data. Users should check TAFs for forecast conditions.
Volcanic ash, convective, tropical cyclone, and international thunderstorm SIGMETs and G-AIRMETS for mountain obscuration are overlaid on the gridded display.
Precipitation
A color-coded grid, derived from the National Digital Forecast Database (NDFD), of weather type, severity, and likelihood is displayed to indicate forecast precipitation. The grids display 'chance' when the probability of precipitation is up to 50%, and 'likely' when the probability of precipitation is greater than 50%. Thunderstorm and winter weather grids are available by selecting the dropdown button within the layer selector.
The corresponding precipitation Weather Symbol is overlaid on the grid.
Convective, tropical cyclone, international thunderstorm, and volcanic ash SIGMET polygons are automatically displayed. NWS hazards associated with precipitation including, tornado, severe thunderstorm, winter storm, winter weather, ice storm, freezing rain and lake effect snow are displayed. Only Severe Thunderstorm and Tornado NWS warnings are included on the thunderstorm tab. A Severe Thunderstorm is defined as a thunderstorm that produces a tornado, winds of at least 58 mph (50 knots or ~93 km/h), and/or hail at least 1" in diameter.
Thunderstorms
A grid of thunderstorm coverage categories is displayed with the thunderstorm type/intensity symbol overlaid. A Severe Thunderstorm is defined as a thunderstorm that produces a tornado, winds of at least 58 mph (50 knots or ~93 km/h), and/or hail at least 1" in diameter.
| Categories | Meaning |
|---|---|
| ISOL (isolated) | Limited in duration and/or coverage and/or intensity |
| SCT (scattered) | Short-lived and/or not widespread,isolated intense storms possible |
| NUM (numerous) | More persistent and/or widespread, a few intense storms |
The corresponding precipitation Weather Symbol is overlaid on the grid.
Convective, tropical cyclone, and international thunderstorm SIGMET polygons are displayed. Only Severe Thunderstorm and Tornado NWS warnings are included.
Add the TFM Convective Forecast (TCF) and the Storm Prediction Center (SPC) Convective outlook using the layers dropdown.
NOTE: TCF will only display at the hours where forecasts are made and will not be displayed at hour 0.
Temperature
View three-dimensional temperature data for levels in 3000 ft. increments from the surface to FL300, and in 6000 ft. increments from FL300 to FL480. The user may also select to view data at the surface (SFC) values. Model temperature data is displayed in a color-coded graphic. Wind barbs can be overlaid on the temperature graphic.
The Weather Sybmols show wind speed and direction depicted by gridded wind barbs, which increase in density as the user zooms in.
Low Altitude: Temperature data is available for levels in 500 ft. increments from SFC to 2000 ft. AGL and 1000 ft. increments from 2000 ft. AGL to 5000 ft. AGL.
Extended Range: Temperature data is available graphically out to four days in the future. Wind barbs can be overlaid on the map.
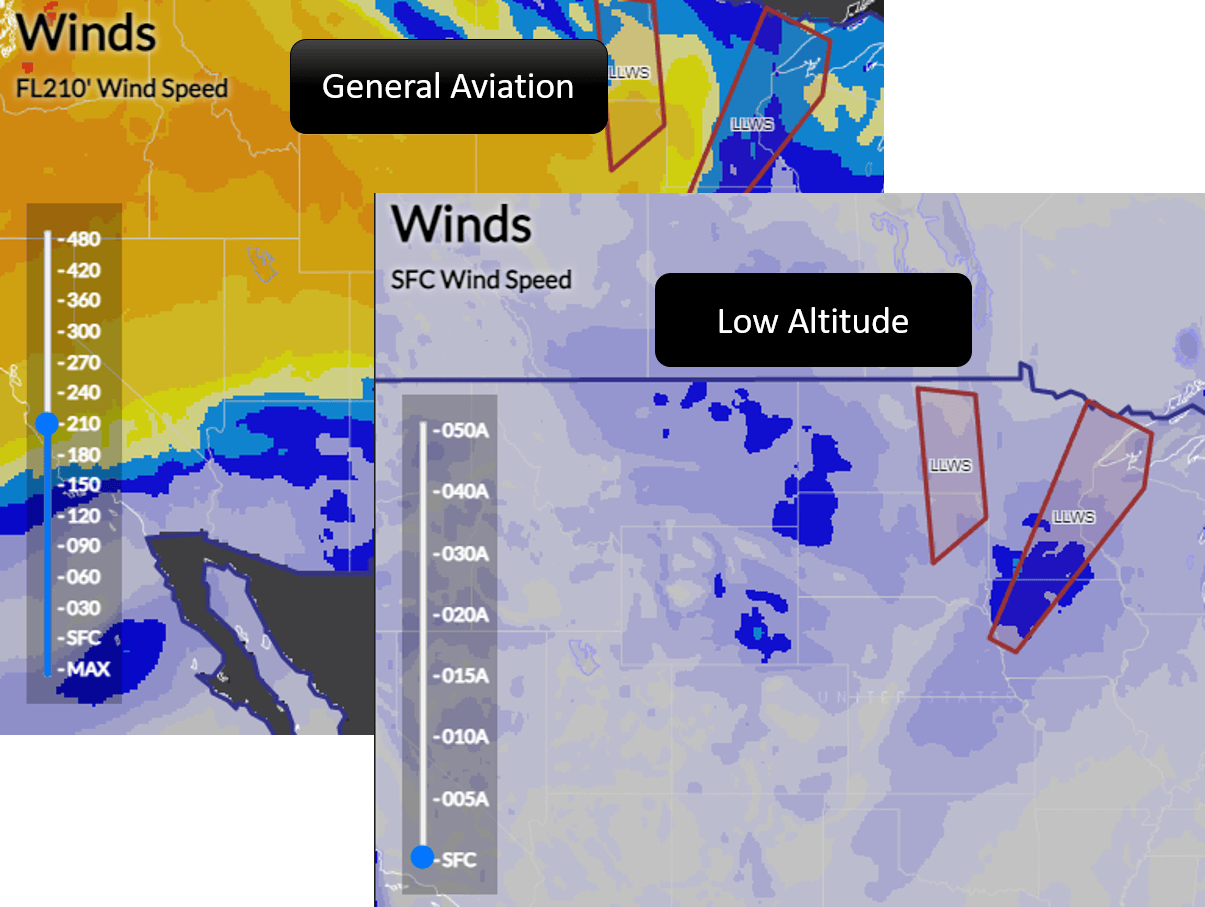
Winds
The user can select to view wind data for levels in 3000 ft. increments from the surface to FL300, and in 6000 ft. increments from FL300 to FL480. The user may also select to view data at the surface (SFC) or the maximum values (MAX) for all levels. Model wind speed is displayed in a color-coded graphic.
The Weather Symbols show wind speed and direction depicted by gridded wind barbs, which increase in density as the user zooms in. When "MAX" is selected, the graphic displayed is the maximum value for wind speed and the associated direction wind barb regardless of flight level.
Convective, tropical cyclone, and international thunderstorm SIGMET and G-AIRMET Tango polygons for low level wind shear and strong surface winds are overlaid on the graphic. NWS wind advisories and warnings, which include Gale, Wind, High Wind, Lake Wind, Winter Storm, Blizzard, Ice Storm, Storm, and Blowing Dust are displayed at the surface. Small Craft warnings for wind will be added in the future.
Low Altitude: Wind data is available for levels in 500 ft. increments from SFC to 2000 ft. AGL and 1000 ft. increments from 2000 ft. AGL to 5000 ft. AGL.
Extended Range: Wind data is available graphically and with wind barbs out to four days in the future.
Turbulence
The graphical turbulence grid is expressed in terms of Eddy Dissipation Rate (EDR) to the 1/3 power, i.e. EDR = (m2/s3)1/3. The user can select flight levels in 3000 ft. increments between FL030 and FL300, and in 6000 ft. increments between FL300 and FL480. The user also has the option to choose "<180" or ">180". When less than or greater than FL180 is selected, the maximum EDR value is displayed for all altitudes below or at and above FL180, respectively.
| Aircraft Weight Class (Max Takeoff Weight) | Estimated EDR Threshold * 100 | |||
|---|---|---|---|---|
| Light | Moderate | Severe | Extreme | |
| Light ( < 15,500 lbs e.g. Cessna 320, Piper Cub, LJ23 ) | 13 | 16 | 36 | 64 |
| Medium ( 15,500 – 300,000 lbs; e.g. A320, B737, Gulfstream ) | 15 | 20 | 44 | 79 |
| Heavy ( > 300,000 lbs; e.g. A330-A380, B747, B777 ) | 17 | 24 | 54 | 96 |
Clear Air, Mountain Wave, and Convectively Induced Turbulence (CIT), along with Low Level Wind Shear (LLWS) are available by selecting the dropdown button within the layer selector. CIT is only available over CONUS as the underlying model only produces CIT on this domain. The LLWS tab displays the magnitude of non-convective wind shear below 2000 ft. AGL. The wind shear values are a difference in wind speed (m/s) divided by depth (m), resulting in units of s-1 (1/s). Warmer colors, with values above 0.12 s-1, indicate areas with stronger wind shear.
G-AIRMET Tango is displayed for turbulence only. It does not include G-AIRMET Tango for surface winds or low level wind shear. Turbulence, convective, tropical cyclone and international thunderstorm SIGMETs are also overlaid. When the "LO" or "HI" level is selected, only the LO or HI SIGMETs are displayed corresponding to the selected level. The LLWS includes G-AIRMET polygons for low level wind shear.
As of March 2026, the high-resolution model that guides the GFA turbulence product over CONUS will only have updated guidance out to forecast hour 16. Forecast hours 17 and 18 will therefore be identical to forecast hour 16.
Low Altitude: Turbulence data is available for levels in 500 ft. increments from SFC to 2000 ft. AGL and 1000 ft. increments from 2000 ft. AGL to 5000 ft. AGL. LLWS values can be displayed by selecting the dropdown button within the layer selector.
Note: Noticeable seams — potential disagreements between multiple turbulence solutions — often occur between the CONUS domain and the open waters of the Pacific and Atlantic oceans, as well as the Gulf. These seams are the result of different turbulence solutions, with different horizontal resolutions, being pieced together in order to cover the entire GFA domain. Additionally, these discrepancies are possible at all vertical levels, including in the GFA-LA.
Icing
The icing graphic provides color-coded icing severity depictions at various altitudes. The icing severity product combines a multitude of weather observations (temperature, humidity, satellite, observed surface weather and pilot reports, radar data, etc.) to diagnose areas of expected trace, light, moderate, and heavy icing. The user can use the vertical slide bar to choose to display the product at 3000 ft. intervals up to FL270. The user may also choose "Max" to display the maximum icing severity for a location regardless of altitude. The severity estimations are roughly based on the accretion rate of ice on an airplane, and the levels are determined by the time it would take for an airfoil to accrete 1/4 in on ice: trace, 1 h; light, 15 min-1 h; moderate, 5-15 min; and heavy < 5 min. The rates are, in turn, estimated from the amount of supercooled liquid water expected with a nominal drop diameter of 15 microns, and are further tuned by nearby pilot reports of encountered severity. These are relative values and the use of which should take into account the airframe and the level of icing protection provided by the aircraft. The ultimate safety factor is the vigilance demonstrated by the pilot in potential icing situations.
View Icing Probability, Supercooled Large drops (SLD), and Freezing Level heights by selecting the dropdown button within the layer selector. Overall icing probability and severity originate from the Forecast Icing Product (FIP) developed by the Federal Aviation Administration (FAA) and National Center for Atmospheric Research (NCAR). These products start with data from the RAP which is run hourly.
Note: FIP is intended for flight planning purposes and should always be used in combination with icing information from all available sources including G-AIRMETs, SIGMETs, and PIREPs. Please also note that FIP severity estimates are not synonymous with the icing PIREP severities of trace, light, moderate, and severe. Icing PIREP severities are subjective estimates by the pilot of the rate of accumulation combined with the use of aircraft deicing systems whereas FIP severity estimates are an attempt to provide guidance based from the characterization of the meteorological environment. FIP aid flight planning and situational awareness through graphical depiction of current and forecast icing conditions across an area or along a route of flight.
SLD are predominantly found at temperatures ranging from 0°C to -20°C, but can be found at temperatures as cold as -40°C. SLD are shown using a red hash over areas with an expected SLD threat. The freezing level is displayed relative to mean sea level (MSL).
The Weather Symbol denoting the winter precipitation type and intensity is overlaid on the graphic.
Two-dimensional G-AIRMET Zulu and Icing, convective, tropical cyclone and international thunderstorm SIGMET polygons are overlaid on the graphic valid at the selected level. All G-AIRMET Zulu, and SIGMET polygons appear when "MAX" is selected. NWS winter storm, blizzard, freezing rain, lake effect snow, winter weather and freezing fog polygons.
As of March 2026, the high-resolution model that guides the GFA icing product over CONUS will only have updated guidance through forecast hour 16. Forecast hours 17 and 18 will therefore be identical to forecast hour 16. Over AK, the model is initialized every 3 hours. Thus, when AK domain does not have updated guidance for forecast hour 15, an icing solution from a different model will fill in this domain.
Low Altitude: Icing data is available for levels in 500 ft. increments from the surface to 2000 ft. AGL and 1000 ft. increments from 2000 ft. AGL to 5000 ft. AGL.
Note: Noticeable seams — potential disagreements between multiple icing severity solutions — often occur between the CONUS/AK domains and the open waters of the Pacific and Atlantic oceans, as well as the Gulf. These seams are the result of different icing severity solutions, with different horizontal resolutions, being pieced together in order to cover the entire GFA domain. Additionally, these discrepancies are possible at all vertical levels, including in the GFA-LA. For more information on the GFA domain, please see the top section of the main help page: GFA Help.
For additional icing information, consult this document: How to Properly Use an Icing Forecast
SIGMET/G-AIRMET/CWA/NWS Warnings
The following table shows which weather elements are displayed on each forecast product tab.
| Product | SIGMET | NWS Warnings | G-AIRMET | Vertical Levels |
|---|---|---|---|---|
| Observations | All | All | – | – |
| Ceiling & Visibility | C-SIG TC TS BD BS VA | WS BZ | Sierra (IFR) | – |
| Clouds | C-SIG TC TS VA | – | Mountain Obscuration | – |
| Precipitation | C-SIG TC TS BD BS VA | TO TS WS BZ IS LS ST | – | – |
| Thunderstorms | C-SIG TC TS | TO TS | – | – |
| Winds | C-SIG TC TS | WS BZ IS ST GA HW | Low Level Wind Shear, Strong Surface Winds | Surface, maximum, every 3000 ft from FL030 to FL300, every 6000 ft from FL300 to FL480 |
| Turbulence | C-SIG TC TS TB | – | Turbulence, Low Level Wind Shear | <FL180, ≥FL180, every 3000 ft from FL030 to FL300, every 6000 ft from FL300 to FL480 |
| Icing | C-SIG TC TS IC | WS BZ IS LS (at SFC) | Icing | Surface, maximum, every 3000 ft from FL030 to FL300, every 6000 ft from FL300 to FL480 |
| TAF | All | All | – | – |
SIGMET
Significant Meteorological Information is a weather advisory that contains meteorological information concerning the safety of all aircraft. There are two types of SIGMETs: convective and non-convective.
US SIGMETs — A US SIGMET advises of weather, other than convective activity, that is potentially hazardous to all aircraft. SIGMETs are issued (for the lower 48 states and adjacent coastal waters) for the following weather-impacted reasons:
- Severe Icing
- Severe of Extreme Turbulence
- Dust Storms and/or Sand Storms lowering visibility to less than 3 miles
- Volcanic Ash
If the total area affected during the forecast period is very large, only a small portion of this total area may be affected at any one time. SIGMETs are issued for 6 hour periods for conditions associated with hurricanes and 4 hours for all other events. If conditions persist beyond the forecast period, the SIGMET is updated and reissued. Convective SIGMETs are issued hourly for thunderstorm-related aviation hazards.
US Convective SIGMETs - Convective SIGMETs are issued in the conterminous U.S. if these conditions are occurring or expected to occur:
- Line of thunderstorms at least 60 miles long with thunderstorms affecting 40% of its length
- Area of thunderstorms covering at least 40% of the area concerned and exhibiting a very strong radar reflectivity or a significant satellite or lightning signature
- Embedded or severe thunderstorms expected to occur for more than 30 minutes
Special issuances occur when severe thunderstorm warning or tornado warning criteria are met.
Any convective SIGMET implies severe or greater turbulence, severe icing, and low level wind shear. A convective SIGMET may be issued for any convective situation which the forecaster feels is hazardous to all categories of aircraft. Bulletins are issued hourly at Hour+55. The text of the bulletin consists of either an observation and a forecast or just a forecast. The forecast is valid for up to 2 hours.
International SIGMETs - US SIGMETs cover the contiguous United States and follow US coding standards. Any SIGMET issued outside of the CONUS follows the international coding standard. The aviation hazards are similar to the US SIGMETs except convective SIGMETs are treated the same as other hazards. Here is the list of hazards:
- Thunderstorms
- Tropical Cyclones
- Turbulence
- Icing
- Volcanic Ash
- Dust and Sand Storms
- Radiological cloud
International SIGMETs are defined within a specific FIR. Most FIRs are aligned with a country's airspace or a subset of that airspace. Ocean regions also have FIRs where SIGMETs are covered by adjacent countries. The US does issue international SIGMETs for Alaska and for oceanic areas off the east coast of the US, the Gulf and a large part of the central northern Pacific.
| AWC SIGMET | Code |
|---|---|
| Convective | C-SIG |
| Tropical Cyclone | TC |
| International Thunderstorm | TS |
| Volcanic Ash | VA |
| Blowing Dust/Sand | IFR |
| Turbulence | TB |
| Icing | IC |
CWA
Center Weather Advisories (CWA) are an aviation weather warning for conditions meeting or approaching national in-flight advisory (G-AIRMET, SIGMET or SIGMET for convection) criteria. The CWA is primarily used by air crews to anticipate and avoid adverse weather conditions in the en route and terminal environments. It is not a flight planning product because of its short lead time and duration. Additionally, the CWA should be meteorologically consistent with other products and reflect conditions at the time of issuance and/or in the near future.
CWAs are valid for up to 2 hours and may include forecasts of conditions expected to begin within 2 hours of issuance. If conditions are expected to persist after the advisory's valid period, a statement to that effect should be included in the last line of the text. Follow-up CWAs should be issued as appropriate. Notice of significant changes in the phenomenon described in a CWA should be provided by a new CWA issuance for that phenomenon. If the forecaster deems it necessary, CWAs may be issued hourly for convective activity. CWAs should be issued for any of the following events when they are expected to occur within two hours and have not been previously forecast by AWC or AAWU products, or to supplement the AWC and AAWU products.
- Conditions meeting convective SIGMET criteria
- Icing - moderate or greater
- Turbulence - moderate or greater
- Heavy or freezing precipitation
- Conditions at or approaching Low IFR
- Surface winds/gusts >30 knots
- Low Level Wind Shear (surface - 2,000 feet)
- Volcanic ash, dust storms, or sandstorms
G-AIRMET
A G-AIRMET is a graphical advisory of weather that may be hazardous to aircraft, but are less severe than SIGMETs. They are only valid at specific time "snapshots" and the nearest valid time snapshot is displayed on the interactive map (Note: This could be a forecasted time). Forecasters create graphical objects depicting the areas and attributes of G-AIRMET hazards, which are distributed in BUFR file format. G-AIRMETs are issued at discrete times 3 hours apart for a period of up to 12 hours into the future (00, 03, 06, 09, and 12 hours). They are issued at 03:00, 09:00, 15:00 and 21:00 UTC (with updates issued as necessary). G-AIRMET are issued by the AWC for the lower 48 states and adjacent coastal waters.
The aviation hazards depicted in the G-AIRMET are:
- Turbulence - Areas of moderate turbulence, other than convectively induced, including the vertical extent.
- Low Level Wind Shear (LLWS) - Wind shear below 2000 feet AGL, other than convectively induced, resulting in an air speed loss or gain of 20 knots or more. LLWS potential information is included after G-AIRMETs for moderate turbulence and/or sustained surface winds greater than 30 knots or statements indicating no significant turbulence is expected.
- Strong Surface Winds - Areas of sustained surface winds greater than 30 knots. The direction and speed of the wind are not depicted; only the area where sustained surface winds greater than 30 knots will occur.
- Icing - Areas of moderate airframe icing, other than convectively induced, including the areal extent.
- Freezing Level - The lowest freezing level above the ground or at the surface as appropriate. Freezing level information is included after G-AIRMETs for moderate icing or statements indicating that no significant icing is expected. Freezing levels are delineated using high altitude VOR locations describing the location of the lowest freezing level above the ground or surface as appropriate. Freezing levels above the ground are delineated at 4000 feet intervals above mean sea level. Multiple freezing levels above the ground are delineated by high altitude and low altitude VOR locations. The range of freezing levels across the forecast area is also included.
- IFR - Areas of cloud ceilings with bases less than 1000 feet above ground level and/or areas of surface visibilities below 3 statute miles, including the weather causing the visibility restriction. The cause of the visibility restriction includes only widespread sand/dust storm, PCPN, FU, HZ, BR, FG, and/or BLSN.
- Mountain Obscuration - Areas of widespread mountain obscuration where VMC cannot be maintained, including the weather causing the obscuration. The weather causing the obscuration includes only CLDS, PCPN, FU, HZ, BR, and/or FG.
NWS Warnings
Text information for relevant NWS textual weather observations and forecasts is available by clicking on the observation or warning. These data are either points of observed or forecast weather, often at airports, or regions of hazardous weather represented by two-dimensional polygons. Text boxes must be reselected after moving the time slider in order to update the information.
| NWS Hazard | Code |
|---|---|
| Blizzard | BZ |
| Gale | GL |
| Hurricane | HU |
| High Wind | HW |
| Ice Storm | IS |
| Lake Effect Snow | LE |
| Severe Thunderstorm | SV |
| Tornado | TO |
| Tropical Storm | TR |
| Tsunami | TS |
| Winter Storm | WS |
Prog Charts
Frontal Analysis
Surface Prog Charts are forecasts for surface conditions. These are generated by WPC and rendered for the web site. WPC provides an analysis updated every three hours plus 12 and 24 hour forecasts updated four times a day and a 36 and 48 hour forecast updated twice a day. In addition, medium range forecasts every day from three to seven days are also provided. These are valid for the contiguous United States.
| Product | Frequency | Times |
|---|---|---|
| Current analysis | 3 hours | every 3 hours about 90 minutes after valid time |
| 12 hour forecast | 4 times daily | ~0200 (valid 12Z), 0400 (18Z), 1300 (00Z), and 1430 (06Z) |
| 24 hour forecast | 4 times daily | ~0430 (valid 00Z), 0700 (06Z), 1330 (12Z), and 1930 (18Z) |
| 36 hour forecast | Twice daily | ~0730 (valid 12Z), 1930 (00Z) |
| 48 hour forecast | Twice daily | ~0730 (valid 12Z), 1930 (00Z) |
| 60 hour forecast | Twice daily | ~0730 (valid 12Z), 1930 (00Z) |
| 3,4,5,6,7 day forecasts | Once daily | ~1400 (valid 12Z). The 3 day forecast is actually a 3 1/2 day forecast |
Precipitation
Areas of precipitation expected at the valid time of the forecast are shaded in colors depending on the type and likelihood of precipitation. The areas are derived from the NDFD grid for weather.
TAFs
TAF is the international standard code format for terminal forecasts issued for airports. Station plots showing the TAF valid for the selected time from the time slider are displayed. The forecast TAFs are plotted using the standard station model where winds, weather, ceiling and visibility are displayed around the station location. The stations displayed follow a progressive priority scheme that will show more stations depending on zoom level. Flight category and cloud coverage is indicated by the colored dots of the forecast stations.
All AWC SIGMET and NWS Warning polygons are displayed.
Forecast Discussion
Weather Forecast Offices across the country issue Area Forecast Discussions (AFD) for their respective forecast region in order to provide the meteorological/scientific reasoning behind a forecast. Although the AFD is comprised of many components, only the aviation section is displayed by region. View the full AFD by using the link in the pop-up window. OCONUS Area Forecasts (FAs)for Alaska, Hawaii, and the Caribbean are also available.
Gate Forecast
Forecasts of significant thunderstorm activity in arrival and departure sectors for the top airports.
Other
Time Slider
Available weather product tabs are configured based on the time selection. The forecast data provide analysis weather information for the current time, and rounded to the nearest top of the hour, forecasted 18 hours in the future. The observation data provide an option to display weather data for the current time and the previous 18 hours (rounded to the nearest hour). Users may advance through time using the arrow buttons or by clicking directly on the desired hour on desktops and larger screens.
Low Altitude: Forecast data is available for the current time and starting at the top of the nearest hour to 6 hours into the future. Observational data is available for the current time and the previous 2 hours in 15 minute increments.
Base maps
- Terrain — The Esri terrain view which gives the most basic of views from the Esri server. This will show relief for hills and mountains at higher zoom levels.
- Road — The Esri road view which gives the more detailed view of roads from the Esri server. This will show detailed city streets at higher zoom levels.
- Satellite - The Esri satellite view which gives a photographic view from the Esri server. This will not show roads so using the highway and road overlay in the map options would be useful with this basemap.
- Dark Grey — Dark mode default map, highlighting land in a grey and waters in black. Countries are labeled and states are outlined in white. This will not show roads so using the highway and road overlay in the map options would be useful with this basemap.
- Light Grey — Light mode default map, highlighting land in white and waters in light grey. Countries are labeled and states are outlined in black. This will not show roads so using the highway and road overlay in the map options would be useful with this basemap.
- VFR Chart (US) — The FAA Visual Flight Rules chart displays georeferenced features, such as airports, mountains and passes, and flight routes. This layer is only available over CONUS and Alaska.
- IFR High Level (US) — The Instrument Flight Rules high altitude chart provides jet route structure, Q-routes, navaids, and selected airports and reporting points designed for navigation at or above 18,000 ft MSL. This layer is only available over CONUS and Alaska.
- IFR Low Level (US) — The Instrument Flight Rules low altitude chart is designed for flights below 18,000 ft MSL.
- Dark — The NASA Blue Marble image. This shows no detail which might be desirable for some more complicated displays. This will not show roads so using the highway and road overlay would be useful with this basemap.
- Light — A simple light background based on the NASA Blue Marble image. This shows no detail which might be desirable for some more complicated displays. This will not show roads so using the highway and road overlay would be useful with this basemap.
- Simple Dark — A blank black background.
- Simple Light — A blank white background which again might be desirable for some complicated displays and output to a printer.
Map Features
- Navigational information — Icons for airports, fixes, navaids, and airways are available at lower zoom levels. Jet routes and boundaries are available at all zoom levels.
- Miscellaneous — Major highways and US interstates, roads, and rivers are available as overlays. Even though the Esri basemap has highways, terrain and road views, it can be difficult to see them with high opacity data overlaid. City polygons and county outlines are available. Icons for features, such as mountains, are available at all zoom levels, and obstacles, such as towers, are available at lower zoom levels.
Guided Tour
Click here for a quick guided tour of the GFA user interface or watch the detailed tutorial video below!
FAA Information
To gather more information on how to read weather data, reference the FAA Aviation Weather Handbook.
Textual Tutorials

Weather Product Dropdown
Select which graphics to display by selecting the data type in the Weather dropdown menu found in the navigation bar at the top of all pages. The selection will load the requested data graphics in the GFA interface. View forecast information by selecting the respective forecast dropdown item: Ceiling & Visibility, Clouds, Precipitation, Thunderstorms, Temperature, Winds, Turbulence, or Icing. All observations, including METARs, satellite, and radar, and PIREPs are viewed upon selection of Observation within the dropdown. The data will load starting with the current analysis data.
Additionally, load forecaster produced products and individual AWC SIGMETs, G-AIRMETs, and CWAs by utilizing the Products dropdown menu. Forecasted Prog Charts, TAFs, and Forecast Discussions can be loaded within the GFA interface by selecting their respective tabs from the Products dropdown menu. Details of the data in each tab option can be found under the Product tab within this help page.
Product Label

The label for the data that is displayed on the graphic can be found in the top left corner. Additional information that is data specific, such as satellite and radar type, or vertical level, is displayed below the data title. The zoomed in example shows that Turbulence data is displayed at FL300'.
Vertical Level Selector
The level slider only appears when viewing Icing, Turbulence, Temperature, Winds, or SIGMETs/G-AIRMETs/CWAs. For these options, the user can select a Flight Level in 3000 ft. up to Flight Level (FL) 300, or 30,000 feet mean sea level (MSL). From FL300 to FL480, the user can select an altitude in 6000 ft. increments. On the warning tabs, the user can view all warnings or only those valid within 3000 ft of a particular flight level. Details of the data displayed at each altitude can be found on the Product tab.
Low Altitude: The level slider goes from the surface up to 2000 ft above ground level (AGL) in 500 ft increments, and 2000 ft AGL to 5000 ft AGL in 1000 ft increments.
Time Slider and Current Time
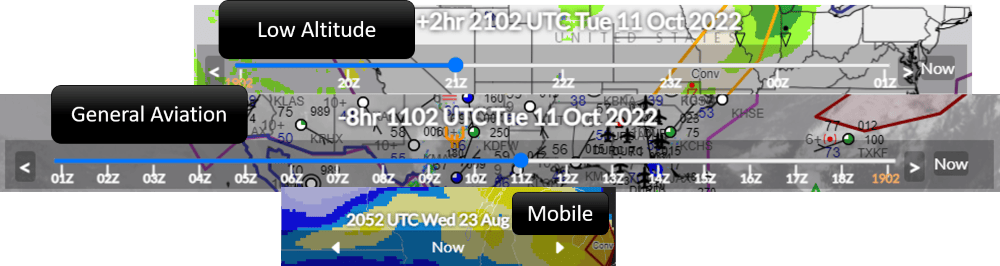
The time slider is along the bottom of the graphic with the valid time (in UTC) for the data displayed directly above. Data will load with the current analysis, and the time is in orange. The time will also display how many hours ahead or behind the current time is selected. The user can select up to 18 hours in the future when viewing the forecast data or 18 hours in the past when viewing observed data. The hour can be selected by clicking and dragging the button on the time slider, clicking directly on the time, or clicking the forward and backward arrows along the bottom of the graphic. All data are synchronized to the time slider, but the user must refresh pop-up boxes to reload data for the adjusted time.
Low Altitude: The time slider goes from current time to six hours in the future in one hour increments when viewing forecast data or backwards two hours in 15 minute increments when viewing observed data.
On smaller screens, including portrait orientation phones, the time slider is collapsed to three buttons: back, now, and forward. The buttons function the same as on the expanded display. The timestamp above indicates the currently selected time.
GFA Type
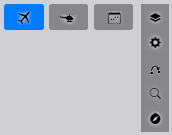
Switch between General Aviation forecasts and observations to Low Altitude data by clicking the helicopter and airplane icons along the top of the graphic. Wind and Temperature pages also provide a calendar button to view an Extended Range forecast out to four days in the future. The time slider and level selector will adjust accordingly, based on which GFA type is selected. Additionally, some data information is set according to the GFA type selected. Learn more specifics on the Product tab.
Layer Selector
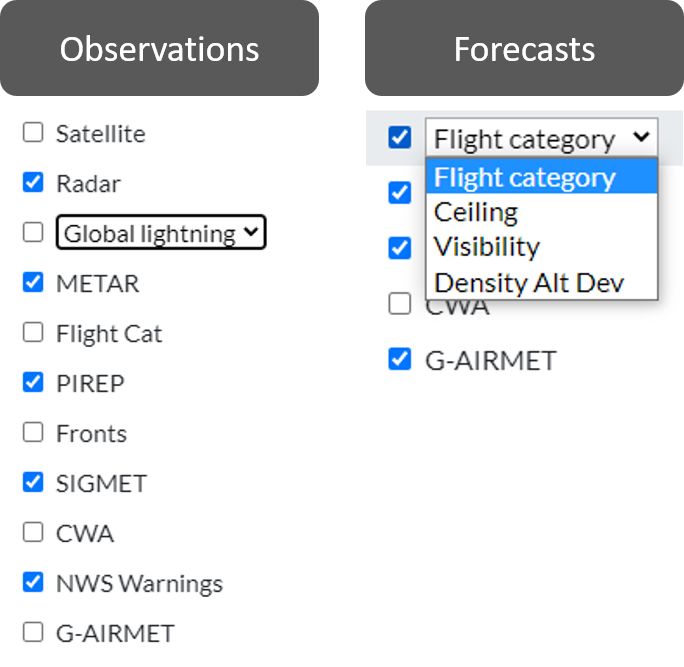
Select which overlays are visible on the graphic by using the layer selector button in the top right corner. The layers which are available for each product will appear in the checklist. All pages provide checkboxes for SIGMETs, CWAs, and NWS Warnings. The user can select to view Satellite, Radar, METARs, PIREPs, lightning, LAMP Ceiling & Visibility Analysis, and Fronts as observation data. The forecast tabs start with a Weather Image dropdown checkbox to remove/add the gridded forecast contours. Ceiling & Visibility, Clouds, Precipitation, Turbulence, and Icing provide an additional selector to switch between related products, learn more about these products on the Product tab of this help page. The Weather Symbol checkbox below that is to remove/add the weather icons from the graphic (wind barbs, precipitation symbols, etc.). Some pages provide a G-AIRMET checkbox, which will display relevant G-AIRMETs for that page. The TAF tab provides the option to turn TAFs off in order to view SIGMETs, CWAs, and NWS Warnings alone.
Map Options
Click the gear icon below the Layer selector at the top right corner to configure the map options. A pop-up window will appear in the middle of the screen providing access to additional settings. Once the settings have been adjusted, they can be saved for future sessions. To close the map options, click the close button or anywhere outside of the pop-up window.
Data
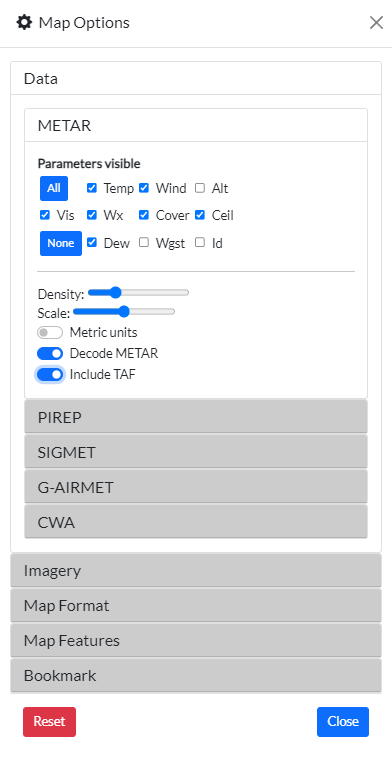
Configure the point data and warning polygons on the graphic using selections from the Data dropdown.
METAR: Select which parameters of the METAR are visible with the parameter checkboxes. A priority scheme is used for progressive display of station plots, therefore, the higher the zoom level, the more stations will be shown. The density for a particular zoom level can be changed with the Density slider.
When larger or smaller METAR station icons are desired, use the "Scale" slider to alter their size. Additional options include displaying TAF data in conjunction with METAR observations, and changing data to metric units. Clicking on a station plot displays a pop-up box containing the latest METAR information in raw format or click the Decoded METAR option to see decoded METARs.
PIREP: Check the boxes next to the types of PIREPs to select what is visible on the graphic. The size of the PIREPs can be changed using the Scale setting. A time window may be specified by selecting the criteria in the Age drop-down menu. The default age of PIREPs is 1.5 hr. Options are available to view PIREPs submitted within 30, 60, 90 minutes and 2, 3, 4, 6, or 12 hours of the current time.
TAF: TAFs are shown in a similar progressive display as METARs. Change the density and size of the TAFs displayed on the graphic by adjusting the Show and Scale sliders, under TAF. View metric TAFs by checking the Metric box, or view decoded TAFs in the pop-up boxes by selecting the Decode TAF checkbox.
Weather Symbol: Change the density and size of the weather symbol overlay by changing the Show and Scale sliders.
SIGMET/CWA: The opacity fill of SIGMETs and CWAs are set to 10 percent but can be increased up to 100% using the Opacity slider. Additionally, SIGMET heights can be displayed by checking the "Heights" checkbox.
Imagery
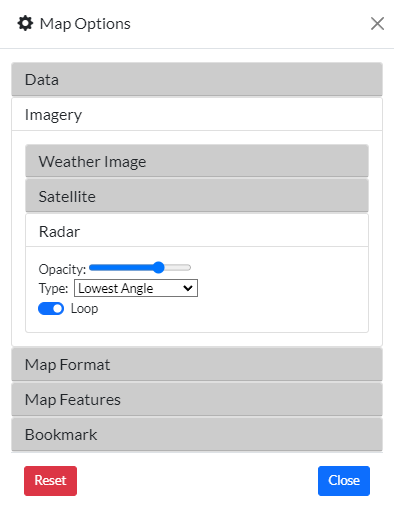
Modify the overlay imagery using the dropdowns within the Imagery dropdown.
Weather Image: Change the opacity of the gridded forecast data. A higher percentage will cover map features. Try adding overlays from the Map Features selections.
Satellite: Layer transparency can be adjusted using the Opacity slider. Satellite imagery is available in either 10km infrared, water vapor, or 5km visible. The default imagery is Infrared, however, visible and water vapor imagery may be displayed via the Type dropdown. The latest image available for the selected time is used.
Radar: Use the opacity slider to change the opacity of the radar. Radar imagery is displayed as a loop of five images ending in the latest available time. The loop represents a 40 minutes time frame, and can be toggled on by unchecking the Loop box. The default Type is the Lowest Angle image, but the user can change it to composite images via the dropdown.
Map Format
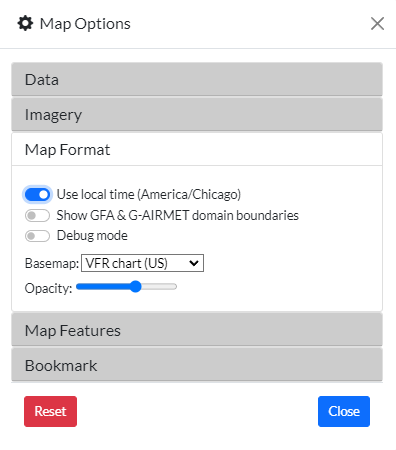
By default the times are depicted in UTC (GMT). Users may elect to use local time by checking the Use local time box. The purple G-AIRMET domain and blue GFA domain can be toggled on and off with the corresponding switches. The GFA display has a selection of twelve base maps. Click the dropdown next to Basemap to change base maps from the default. Learn more about the map types in the "other" section of the Product tab. Change the opacity of the basemap using the opacity slider.
Map Features
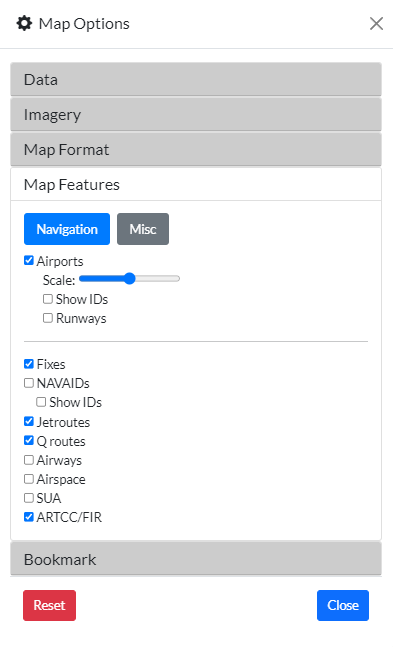
There are two tabs in the Map Features dropdown. The Navigation tab provides selections for map overlays to aid in flight navigation. The second tab, labeled Misc, has overlay options to provide additional geographical information. The selections highways, roads, cities, counties, rivers, features, obstacles, and a lat/lon grid overlay the imagery and will be visible even with a greater opacity image.
Bookmark
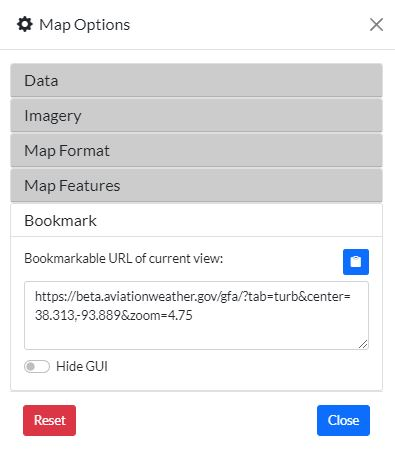
Bookmark the page exactly as it is using the bookmark dropdown. The page is designed to remember where the map is centered, zoom level, and the desired settings you have previously set. The clipboard on the right will copy the URL and you can paste that link into your bookmarks to open the page with your preferences in the future.
Flight Path and Cross Section
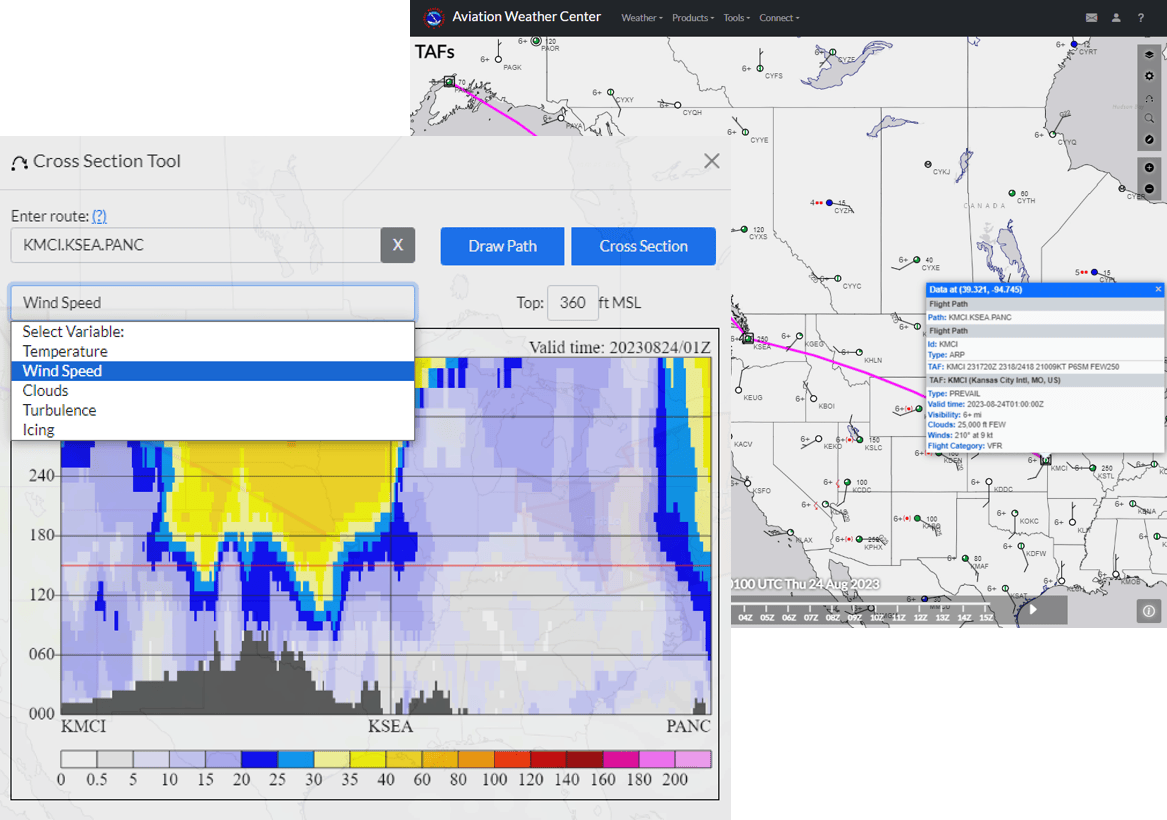
Click on the route icon of an arrow connecting two dots below the layer selector and map options to access the cross section tool and add a flight path route to the display. A pop-up window will appear in the middle of the graphic, where the user can enter a list of airports and/or way points in a variety of formats (see below). Waypoints can be delimited with periods, commas, or spaces.
Examples:
- 4 letter ICAO ids for Airports
- KMCI. KGRI. KMCK. KDEN
- kmci kgri kmck kden
- LAAKE, KASPR, HELLO
- hobol.taggs.nofly.pyrit.dextr
- PIA BDF EON BVT
- psb,ihd,gve,hpw,cvi
- 4756N/9710W, 4359N/8833W
- 6218N/15007W.4742N/12251W
- KDEN,3940N/10115W,BARBQ,BVT,KORD
- PANC. 5414N/13030W. YZT. MCCUL. KSEA
5 Letter FIX ids
NOTE: Fixes will only work over CONUS
3 Letter VOR ids
####N/#####W lat/lon in degree and minutes
A combination of those waypoints
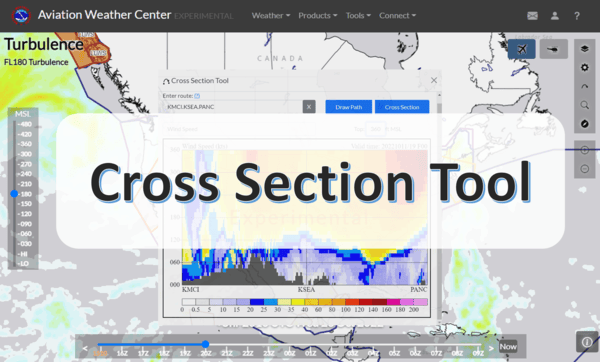
With the route entered, click Draw Path. The dialog box will close and a pink line will appear on the map displaying the flight path. Click on the waypoints to get additional information. To view the cross section, simply reopen the pop-up and select Cross Section. Select the variable you wish to view using the dropdown on the second line and lower the top altitude using the dropdown next to "Top". The vertical heights are displayed along the left of the diagram with the waypoints that are identified spaced along the bottom. A legend for the variable displayed is visible along the bottom and the time stamp at the top right displays the current time and forecast hour. Move the time slider forward on any of the forecast tabs to view forecasted cross sections through the next 18 hours.
Click here to watch a short video on how to use the cross section tool.
Search Button
Click on the magnifying glass below the Flight Path Tool to open a search bar. Type the 4 letter station identifier, 5 letter FIX, or 3 letter VOR in the input box and the map will pan to center that location on the graphic.
Compass Button
Center the map over your location using the compass icon.
Legend Button
Click the icon in the bottom right corner of the display to view the legends. The various elements in the legend will change to only show those applicable to the tab the user has selected. Click the info button again to minimize the legend.
Keyboard Shortcuts
Use the shortcuts to quickly move to areas of the map or modify settings.
- - Map Settings
- - Page Refresh
- - Dark mode
- - Go to, station search box
- - Move time slider
- - Move level slider
- - Sets the time slider to 0
- - Close pop up
- / - Zoom in
- - Zoom out
Switch to other GFA tabs using the following shortcuts
- - Observations
- - TAF
- - Ceiling and Visibility
- - Clouds
- - Precipitation
- - Winds
- - Turbulence
- - Ice
- - G-AIRMETs
Weather Symbols
| Symbol | Station code | Description |
|---|---|---|
| Rain and Snow | ||
| -RA | Light Rain | |
| RA | Moderate Rain | |
| +RA | Heavy Rain | |
| -FZRA | Light Freezing Rain | |
| FZRA +FZRA | Moderate to Heavy Freezing Rain | |
| -RASN | Light Rain and Snow | |
| RASN +RASN | Moderate to Heavy Rain and Snow | |
| -SN | Light Snow | |
| SN | Snow | |
| +SN | Heavy Snow | |
| BLSN | Blowing Snow | |
| DRSN | Drifting Snow | |
| SG | Snow Grains | |
| IC | Ice Crystals | |
| PE PL | Ice Pellets | |
| Showers and Storms | ||
| -SHRA | Light Rain Showers | |
| SHRA +SHRA | Moderate to Heavy Rain Showers | |
| -SHRASN | Light Rain and Snow Showers | |
| SHRASN +SHRASN | Moderate to heavy rain and snow showers | |
| -SHSN | Light Snow Showers | |
| SHSN +SHSN | Moderate to heavy snow showers | |
| -GR | Light showers with hail, not with thunder | |
| GR | Moderate to heavy showers with hail, not with thunder | |
| VCSH | Vicinity showers | |
| VCTS | Vicinity thunderstorm | |
| VCTSRA | Vicinity thunderstorm with rain | |
| TS | Thunderstorm with or without precipitation | |
| TSRA | Thunderstorm with light to moderate rain | |
| +TSRA | Thunderstorm with heavy rain | |
| TSGR | Thunderstorm with light to moderate hail | |
| TSSN | Thunderstorm with light to moderate snow | |
| SQ | Squalls | |
| FC | Funnel Cloud or Tornado |
| Symbol | Station code | Description |
|---|---|---|
| Fog and Mist | ||
| BR | Mist or Light Fog | |
| FG | Fog, sky indiscernible | |
| MIFG | More or less continuous shallow fog | |
| VCFG | Vicinity Fog | |
| BCFG | Patchy Fog | |
| PRFG | Fog, sky discernible | |
| FZFG | Freezing Fog | |
| -DZ | Light Drizzle | |
| DZ | Drizzle | |
| +DZ | Heavy Drizzle | |
| -FZDZ | Light Freezing Drizzle | |
| FZDZ +FZDZ | Moderate to heavy freezing drizzle | |
| -DZRA | Light drizzle and rain | |
| DZRA | Moderate to heavy drizzle and rain | |
| VIRGA | Virga or precipitation not hitting ground | |
| Dust, Sand, Other | ||
| FU VA | Smoke or Volcanic Ash | |
| HZ | Haze | |
| DU SA | Dust or Sand | |
| BLDU/BLSA | Blowing Dust/Blowing Sand | |
| PO | Dust Devil | |
| VCSS | Vicinity Sand Storm | |
| SS | Sand Storm | |
| +SS | Strong Sand Storm | |
| UP | Unknown Precipitation/Weather |
Pilot Reports
| Symbol | Description |
|---|---|
| Turbulence not encountered | |
| Smooth-light turbulence | |
| Light turbulence | |
| Light-moderate turbulence | |
| Moderate turbulence | |
| Moderate-severe turbulence | |
| Severe turbulence | |
| Extreme turbulence | |
| Low-level wind shear |
| Symbol | Description |
|---|---|
| Icing not encountered | |
| Trace icing | |
| Trace to light icing | |
| Light icing | |
| Light to moderate icing | |
| Moderate icing | |
| Moderate to severe icing | |
| Severe icing | |
| Other |
Prog chart (fronts)
| Symbol | Description |
|---|---|
| Cold front (dashed: frontogenesis/frontolysis) | |
| Warm front (dashed: frontogenesis/frontolysis) | |
| Stationary front | |
| Occluded front | |
| Trough | |
| Dry line | |
| Squall | |
| Hurricane / tropical storm |
Map features
| Symbol | Name |
|---|---|
| Stadium | |
| Tall obstacle | |
| Medium or small obstacle | |
| Wind farm | |
| Mountain | |
| Volcano | |
| Pass | |
| Camera |
Navigational aids
| Symbol | Name | Description |
|---|---|---|
| VOR | VHF omnidirectional range | |
| DME | Distance measuring equipment | |
| VOR/DME | Co-located VOR and DME | |
| TACAN | Tactical air navigation system | |
| VORTAC | Co-located VOR and TACAN | |
| NDB | Non-directional beacon | |
| RNAV | Area navigation | |
| Fix | Other navigation fix |
Clouds
| Symbol | Code | Description |
|---|---|---|
| CLR | Clear | |
| FEW | Few | |
| SCT | Scattered | |
| BKN | Broken | |
| OVC | Overcast | |
| VV/OVX | Vertical visibility | |
| Missing |
Flight Category
| Symbol | Category | Description |
|---|---|---|
| VFR | No ceiling or ceiling greater than 3,000 feet AGL and greater than 5 mile visibility | |
| VFR* | VFR with non-ceiling clouds below 3,000 ft AGL | |
| MVFR | 1,000 to 3,000 feet AGL and/or 3 to 5 miles | |
| IFR | 500 to below 1,000 feet AGL and/or 1 mile to less than 3 miles | |
| LIFR | Below 500 feet AGL and/or less than 1 mile | |
| n/a | Ceiling and/or visibility unavailable |
Airports
| Symbol | Description |
|---|---|
| Airport | |
| Heliport | |
| Seaplane base | |
| Private |
What has changed recently?
The entire site was overhauled in October 2023 and the API was overhauled in September 2025. For information about the most recent updates, please see the change log.
How can I keep up with planned changes?
Major changes are announced through NWS Service Change Notices. Further information and other significant changes are shown on the upcoming changes page. Subscribe to the RSS or JSON feed for regular updates.
How often do you update the website?
We fix critical bugs as soon as possible, and we deploy functional upgrades regularly. Please let us know if you find something that isn't working.
Why can't I log in to my account?
Most features of AviationWeather.gov do not require an account. If you recently signed up for a new account, please check your email (including spam folders) for a confirmation email as email addresses must be verified. Accounts are generally approved within one to two business days.
Where is the METAR page?
The interactive Graphical Forecasts for Aviation observation tab displays METARs along with other current data including surface fronts and radar imagery. To view METARs alone, click on the Layers button at the top right corner of the map and deselect items you do not wish to view. Decoded METARs can be displayed by enabling the "decoded METARs" option in the Map Options under the gear icon on GFA.
Raw and decoded textual METAR data can be displayed by selecting the Products dropdown and selecting METAR data.
Where is the Satellite/Radar page?
Satellite and radar imagery are available on the observations tab of the interactive Graphical Forecasts for Aviation, that displays surface observations, imagery, fronts, and more in one place. Satellite imagery is an optional layer available from the layer selector in the upper right corner of the map. To display satellite or radar imagery alone, deselect items on the layer selector to simplify the display.
How can I submit PIREPs?
Sign up for an account on our registration page, select PIREP Submit Access, and be sure to include your airman's certificate number or affiliation with an airline, flight school, government or military organization for validation purposes to streamline the process. Accounts are validated via the FAA Airmen Inquiry.
Then watch your email in order to verify your address and then confirming your account. Once you have an account and are logged in, select "Submit a PIREP" from the Tools dropdown and fill out the form. For more information on PIREP submit, use the link at the bottom, or click here. For more information on PIREP content, please see the PIREP data help page.
How do I access the Flight Path Tool?
The flight path tool is now embedded into the interactive Graphical Forecasts for Aviation map. Click on the route button along the right side of the map to open the display. Enter the airports to navigate, and select the product you wish to display from the dropdown. Watch a video on how to use the cross sections here.
Where is the HEMS (Helicopter Emergency Medical Services) tool?
The HEMS tool has been integrated into the interactive Graphical Forecasts for Aviation. Click on the helicopter button in the upper right part of the map to switch GFA from general aviation mode into low-altitude mode, which offers similar features as the HEMS tool.
What happened to ADDS?
The ADDS static graphics were phased out and replaced with the Graphical Forecasts for Aviation, which offers greater flexibility and configurability; some static graphics continue to be available for decision support. The ADDS Text Data Server has been succeeded by the Data API. Please let us know if you need assistance with the migration.
How can I display list of METARs and/of TAFs? What about decoded products?
The METAR and TAF data pages provide access to raw, tabular, and decoded output that automatically refreshes every five minutes. The page is designed for quick lookups and printability.
Where is the Text Data Server? How do I download METARs?
The Text Data Server was discontinued and has been replaced by the Data API. The new data offerings are more flexible and provide more data. Interfaces designed for greater compatibility with the Data Server to ease the transition as well as cache files to retrieve many reports at once are also available.
How do I access data for previous dates?
The METAR data page displays up to the previous 96 hours of observations. The Archive View allows viewing nearly all products on the site as they were presented for up to the past two weeks. For data more than 14 days old please reference the resources available on bottom of the Archive View page.
Data appears to be missing. Where can I find more information?
Automated status information and the latest announcements can be found on the status page
Why is a particular station not reporting?
The site generally displays all observations within a minute or two of being reported as we receive it. Individual station outages are usual indicative of a problem at the source. AWC does not maintain weather stations or observing platforms.
What do all of the map symbols indicate?
A full listing of map symbols is available.
Why is the map dark?
Dark mode is automatically applied based on systems settings. Selecting the person icon in the upper right and and selecting Light disables this mode.